HUNG NGUYEN
ACTIVITIES
CERTIFICATES
EXPERIENCE
MY WORKS
WHAT I DO
HOME
Data Visualizations
Welcome to my visualization showcase.
Shoutout to
storytelling with data
for much guidance on the work.
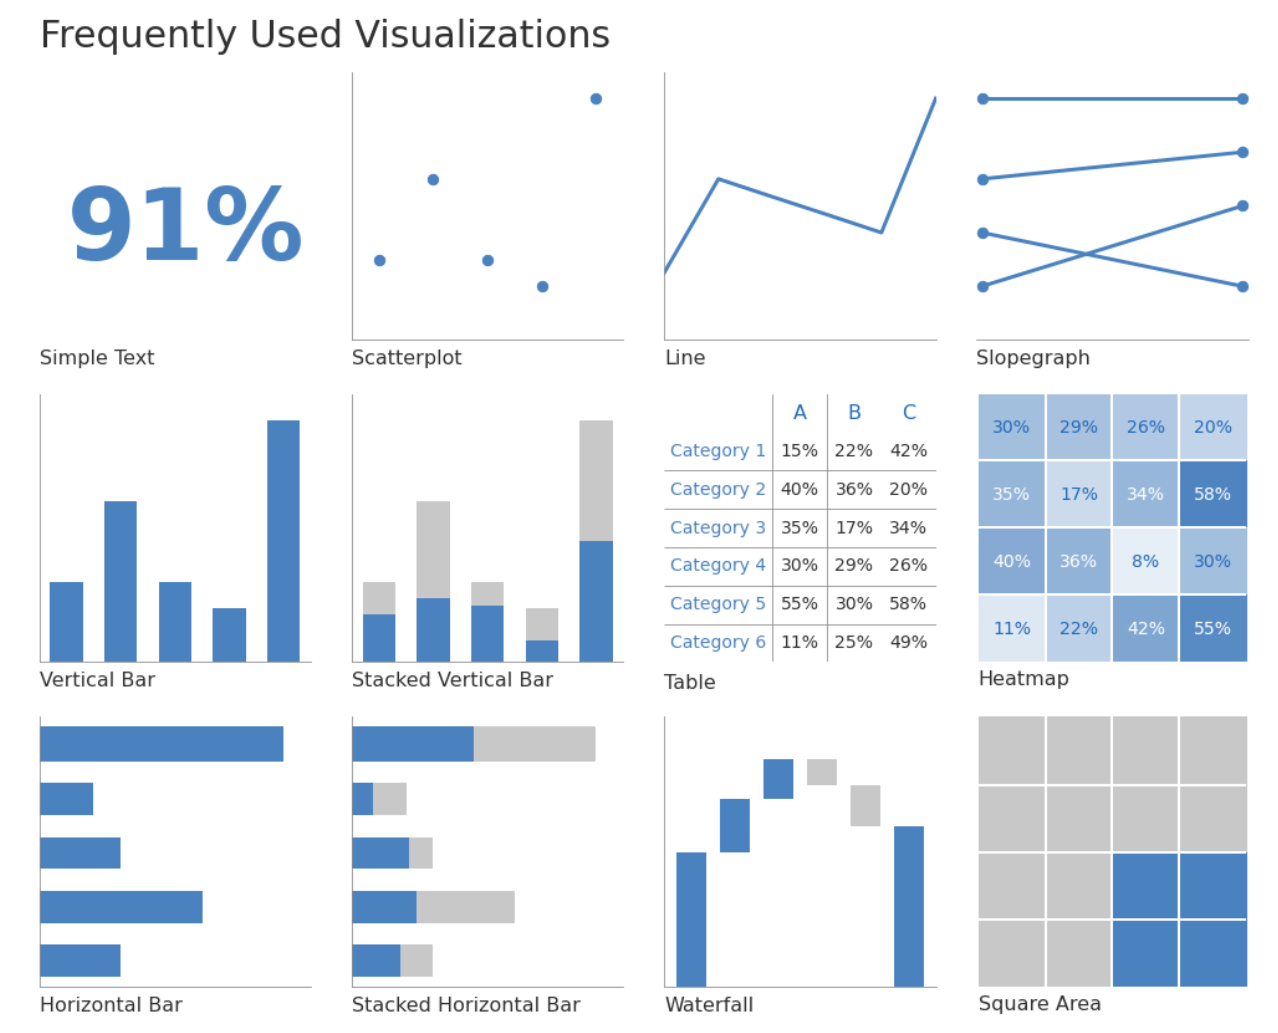
Matplotlib
Frequently Used Visualization
Simplicity is the way. Death to pie chart!
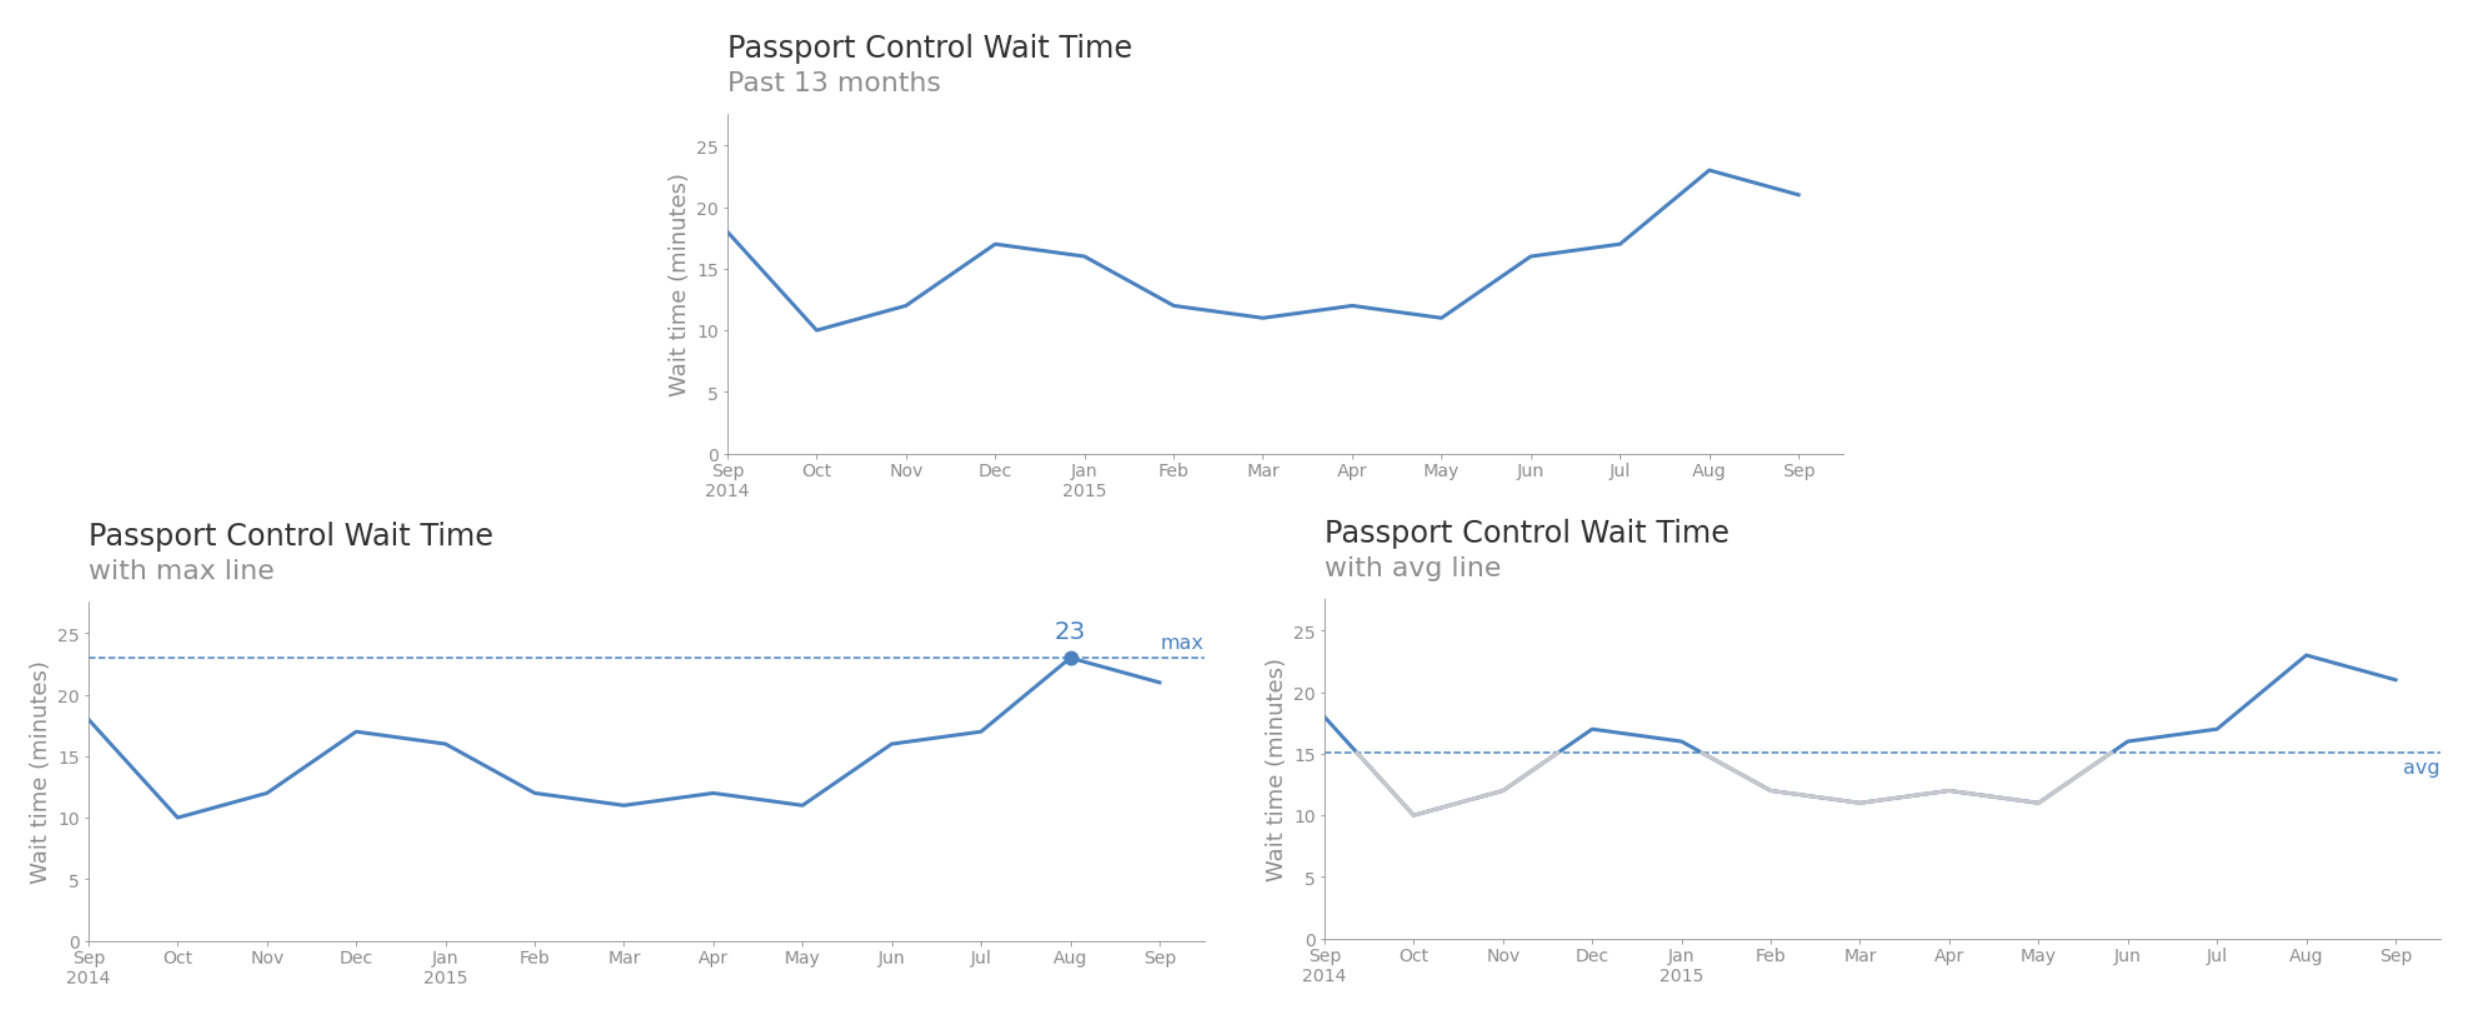
Matplotlib
Simple Line Charts
One series with some annotations.
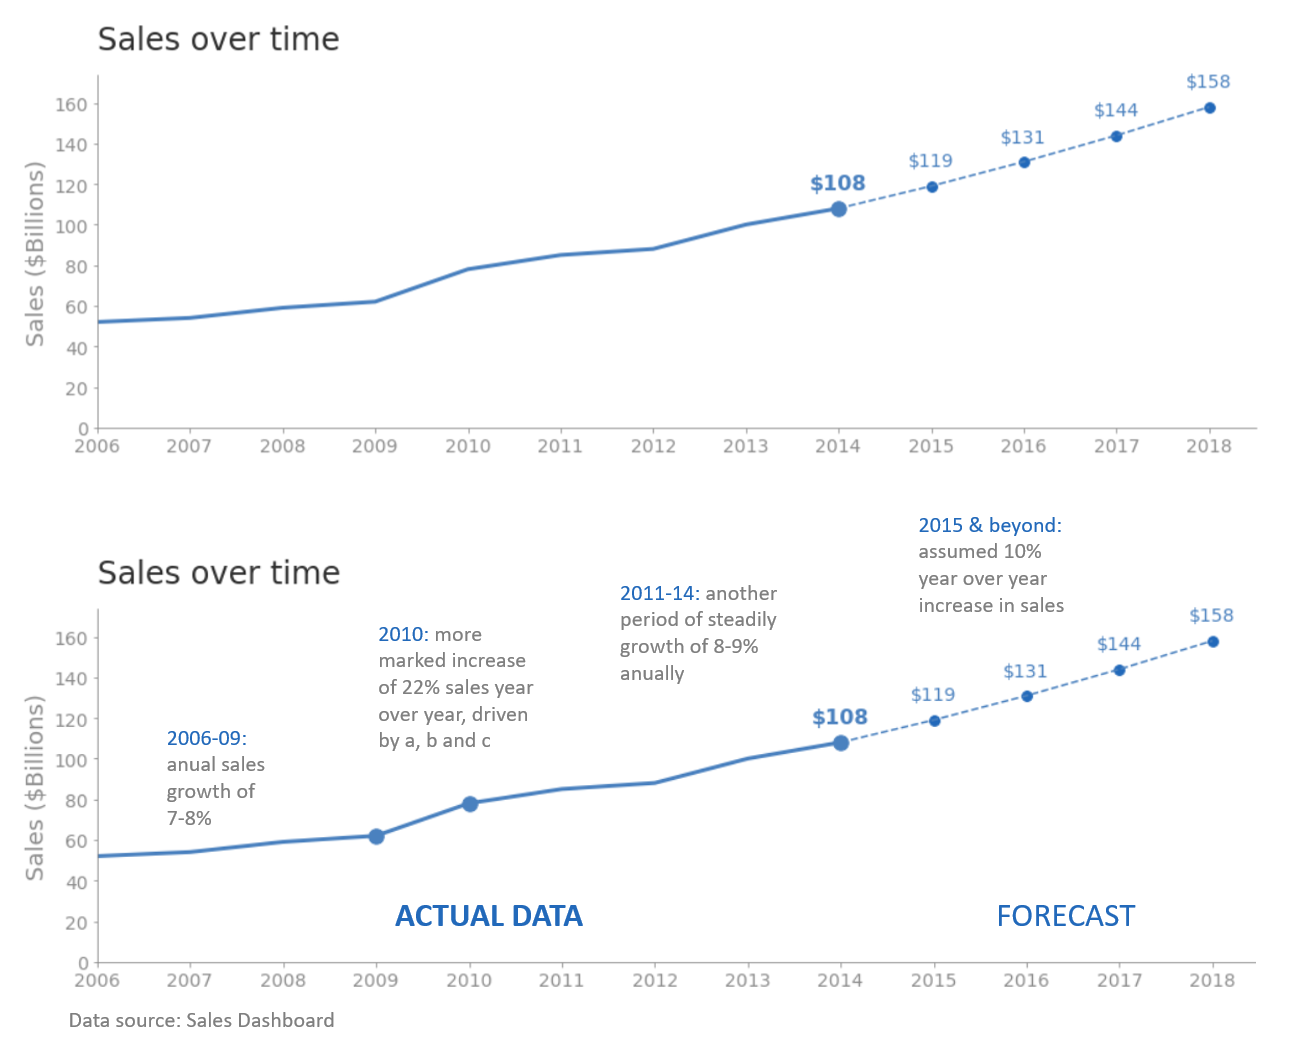
Matplotlib & Powerpoint
Line Chart with Forecast Data
Plotting with Matplotlib then adding details with MS Powerpoint.
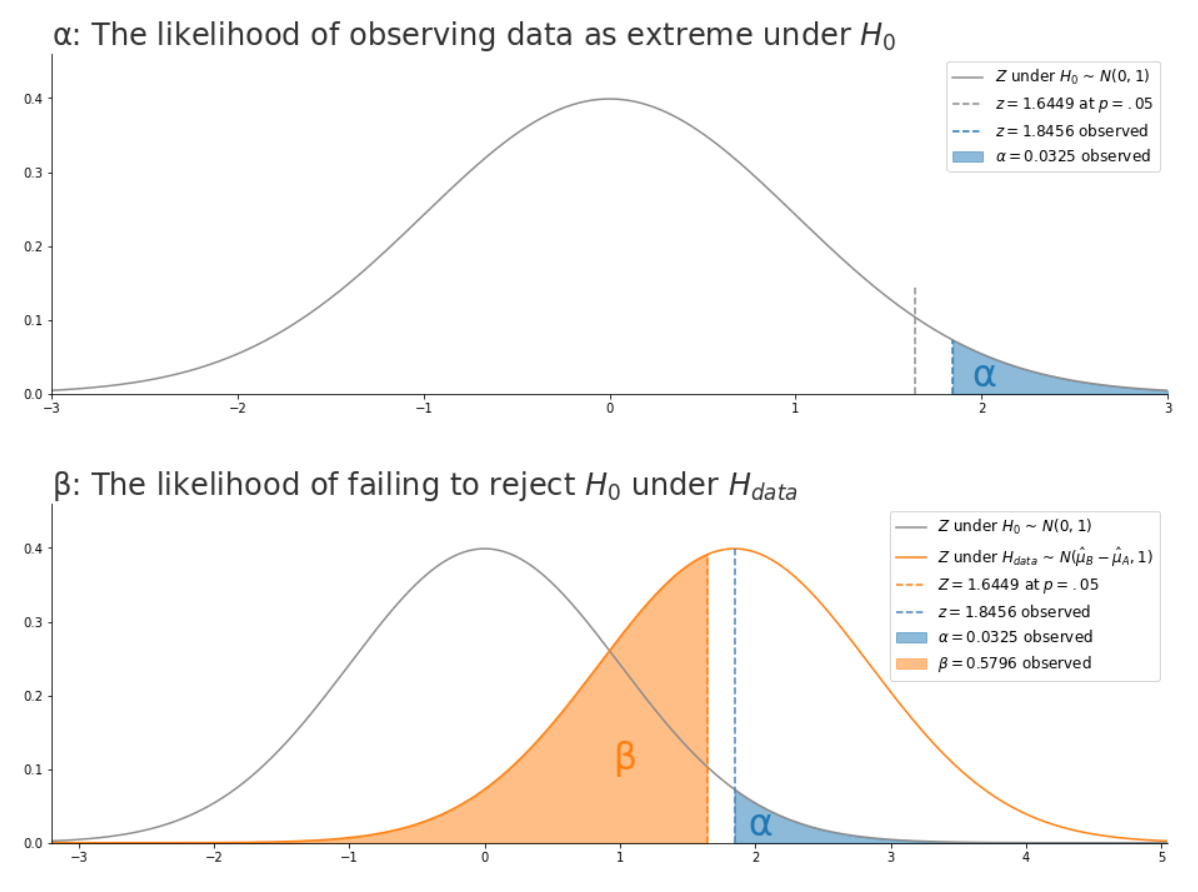
Matplotlib
A/B Test Results with Z-Test
Visualizing A/B Test Results: Z-score, Observed α & β.
Updating...